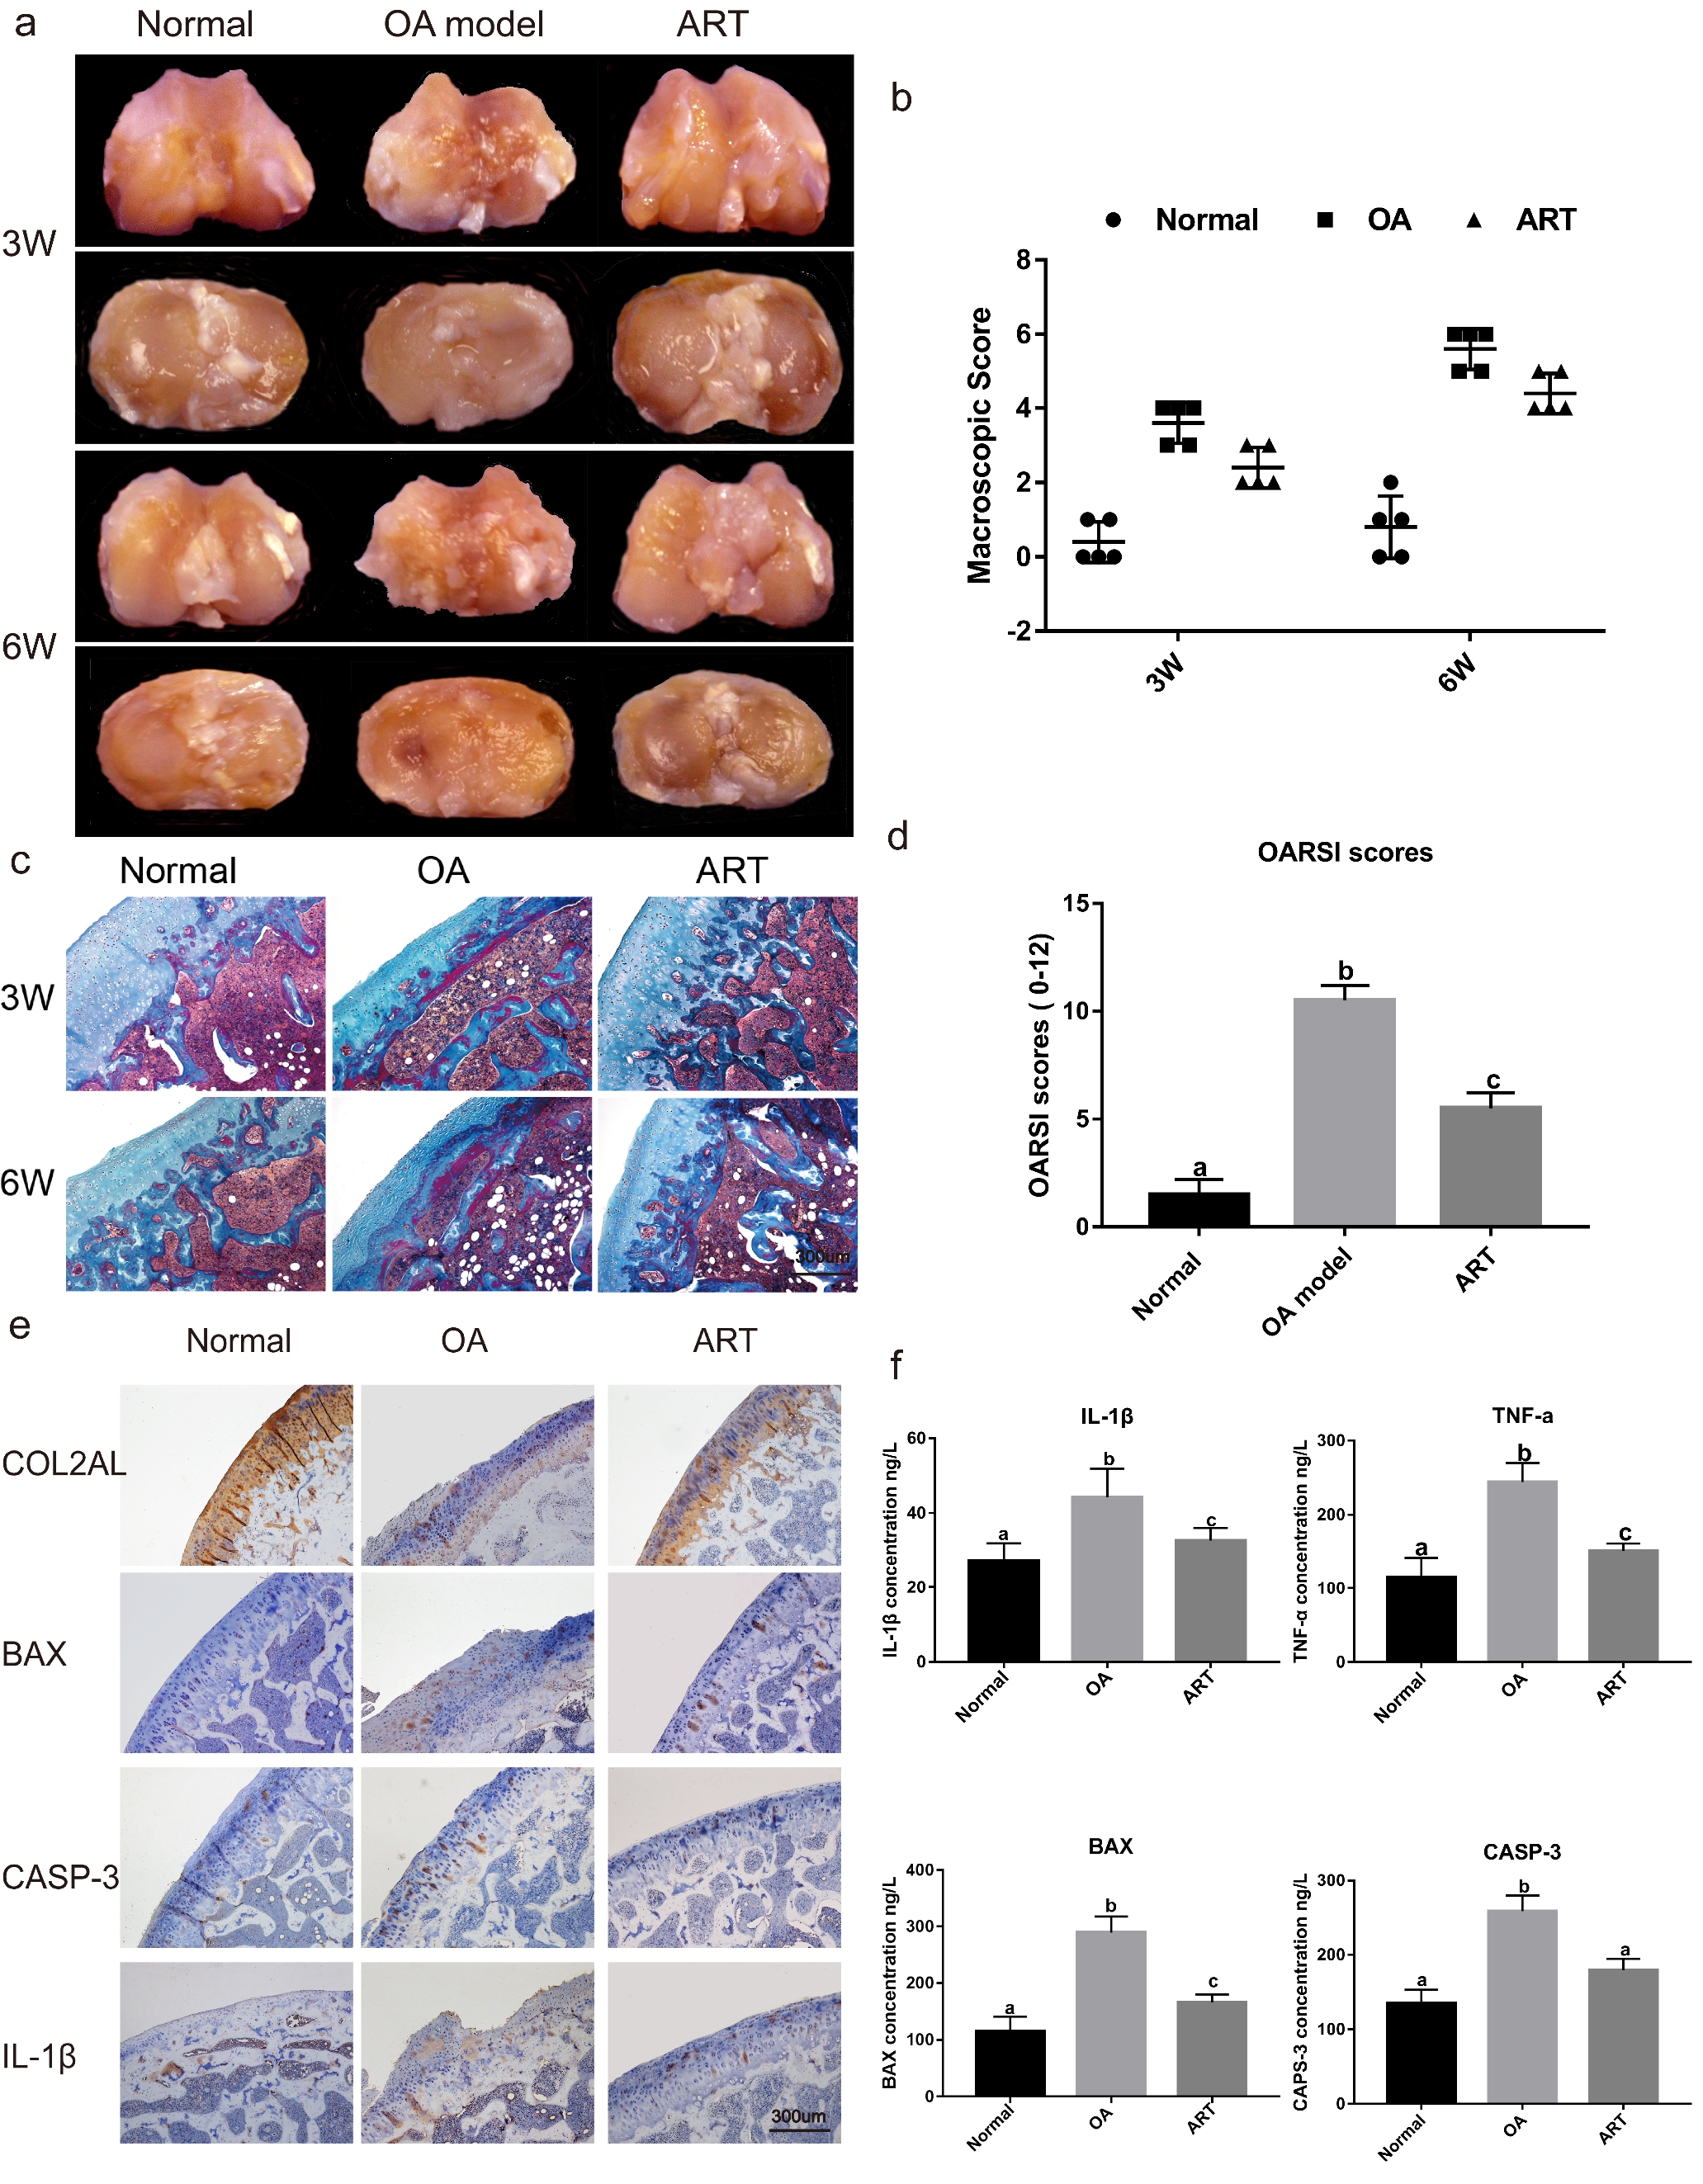
Fig. 3. Effect of ART on the treatment of OA in vivo. (a) Macroscopic appearance. (b) Macroscopic scores. (c) Masson staining was performed in sections of cartilage. (d) Histopathology OARSI System score. (e) Immunohistochemical staining of Col2A1, BAX, CASP-3, IL-1β. (f) ELISA was used to analyze protein expression level of IL-1β, TNF-α, BAX, CASP-3 in joint fluid. OA model group (injected with 0.1mL PBS , n=5), ART group (injected with 0.1 mL of ART, 4.0 ug/mL , n=5); Values are presented as the means ± SD, n=5 joints, different letters denote significances with P<0.05 and the same letter shows no significant differences (P = 0.05).